Chapter 10. Performance
One of us had a computer science lecturer who began one class by saying, “You should never, ever, ever try to optimize your code. But when you do optimize your code, here’s how you should do it.”
Premature optimization, as Donald Knuth once said, is the root of all evil. It would be best if you first made your code work. Then make your code maintainable. And only then—if you have a problem—should you worry about making your code fast. Slow code that works will always beat fast code that doesn’t.
That said, there are times when performance can be a significant issue. If your application takes more than a few seconds to load, you may lose users who will never return. Slow can become unusable on low-powered devices. This chapter will take what we like to call an essentialist approach to performance. You should rarely tune your code, but when you do, you should tune the right code. We look at various tools and techniques that will allow you to track down and measure performance bottlenecks so that if you do need to apply performance fixes, they will be in the right place, and you will have some way of measuring the difference they make.
All performance fixes come at a cost. If you make your client code faster, it might cost more memory or more server time. You will almost always have to add more code and more complexity.
The recipes in this chapter follow the order in which we would suggest you approach performance problems. We begin with high-level
measurements in the browser and look at ways that you can objectively identify performance bottlenecks. If you find a bottleneck, we
will show you how you can use React’s built-in Profiler component to track down the individual components that are the source of the
problem. We then look at lower-level and more precise ways of measuring performance down to the sub-millisecond level.
Only once you can precisely measure performance can you even think about improving the speed of your code.
We then show you just a few ways that you can improve the performance of your application. Some are simple, such as splitting your code into smaller bundles or combining asynchronous network calls. Others are more complex, such as pre-rendering your pages on a server.
In summary: this chapter is far more about performance measurement than performance tuning. Because you should never, ever, ever optimize your code, but when you do, you should begin with measurement.
Use Browser Performance Tools
Problem
It is worth delaying performance tuning until you know you have a problem. In a sense, the only time you have a problem is if a user notices that your application isn’t performing. But if you wait until a user notices, that might be too late. For that reason, it would be helpful to have some objective measure for when an application needs tuning, something that realistically measures performance and isn’t just looking for code that could run faster. You can almost always make code faster, and many developers have wasted many hours tuning code that results in no noticeable effect on the user experience.
It would be helpful to have a tool that will focus on where you might need to optimize your code.
Solution
The best way to check for performance is by using a browser. In the end, the user’s experience is the only thing that matters. So, we will look at the various in-browser tools that will provide objective measures and find potential bottlenecks in your code.
The first thing we will look at is a tool built into Chrome called Lighthouse.
Google produces an add-in for Firefox called Google Lighthouse. Although this works well, it is simply a frontend for the Google Page Speed service, so you can use it only on public-facing web pages. However, you can use the Lighthouse extension in Chrome on any page that Chrome can read.
The Lighthouse extension is a great way to check the basic road-worthiness of your application. As well as checking performance, Lighthouse will look at the accessibility of your web page and whether you are following best practices for the web. It will check whether your pages are optimized for search engine robots and will look to see if your web application meets the standards required to consider it a progressive web application (see Figure 10-1).
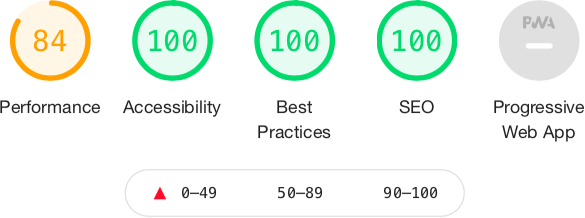
Figure 10-1. The metrics checked by Lighthouse
You can run a Lighthouse audit in two ways: either on the command line or in a browser.
If you want to run audits on the command line, you will first need to install the Lighthouse command:
$ npm install -g lighthouseYou can then run an audit with the lighthouse command:
$ lighthouse http://localhost:3000The command-line version of Lighthouse is simply an automated script for the Google Chrome browser. It has the advantage that it generates an HTML report of the audit, which makes it suitable for use on a continuous integration server.
You can also use Lighthouse interactively, within Google Chrome. It’s best to do this in an incognito window, as this will reduce the likelihood of other extensions and storage interfering with the Lighthouse audit. Once you have started Chrome and opened your application, go to developer tools and then switch to the Lighthouse tab (see Figure 10-2).
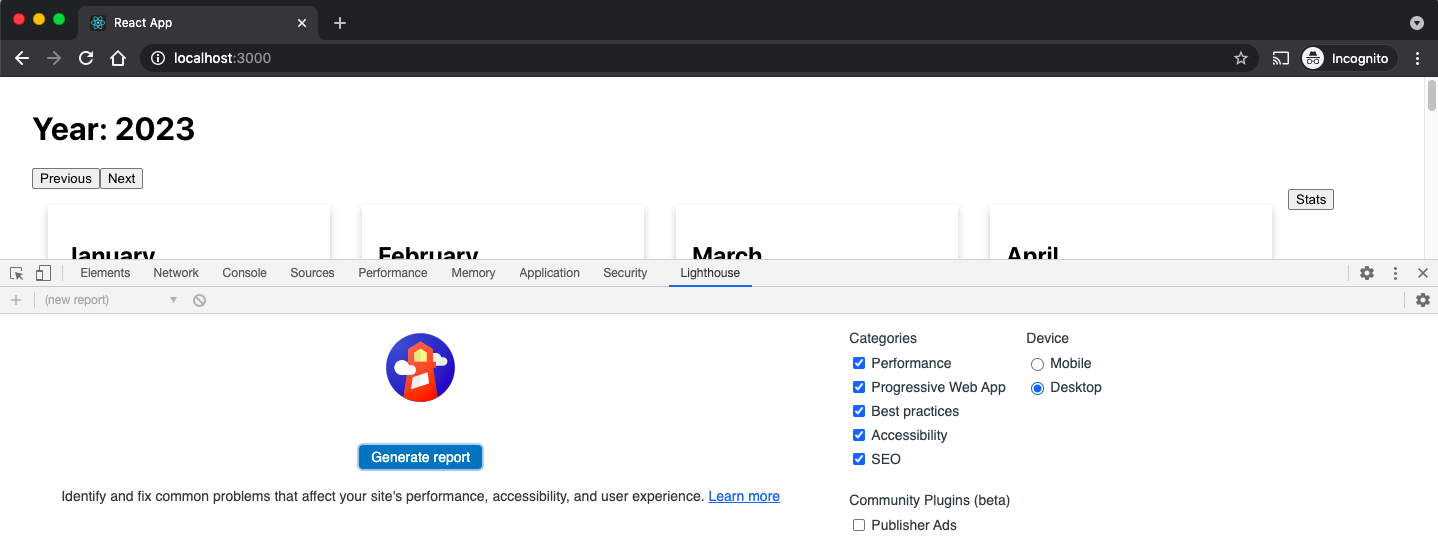
Figure 10-2. The Lighthouse tab with Chrome DevTools
Then click the Generate audit button. Lighthouse will refresh your page several times and perform a series of audits. The performance audit will concentrate on six different metrics (see Figure 10-3).

Figure 10-3. The six web vitals measured by the Lighthouse performance audit
These metrics are known as web vitals. The web vitals are metrics that you can use to track performance when applications are running in production.
The First Contentful Paint (FCP) is the time taken for the browser to start to render content. The FCP will significantly affect the user’s perception of performance. Before the FCP, the user will see only a blank screen, and if this lasts for too long, the user might close down the browser and go elsewhere.
Lighthouse measures the time taken for the FCP and then compares that against the performance statistics Google records globally. If your application is in the top 25% of FCPs globally, it will mark you as green. Currently, a green rating means that the first content renders within two seconds. If you are within the top 75%, it will give you an orange grade, which means your page started to render within four seconds. Lighthouse will give anything else a red grade.
The Speed Index (SI) measures how long it takes until your page stabilizes visually. It performs this check visually by recording a video and checking for differences between frames.
Lighthouse will compare the SI metric to website performance globally. If the SI takes less than 4.3 seconds, you are in the top 25% of web pages globally, and Lighthouse will give a green rating. If you take less than 5.8 seconds, you will be in the top 75%, and Lighthouse will give you an orange rating. It will give everything else a red grade.
The Largest Contentful Paint (LCP) occurs when the browser’s viewport is completely loaded. Other content might still be loading out of view, but the LCP is when the user will feel that the page is visible. To be rated green, the LCP needs to be within 2.5 seconds. It needs to be less than 4 seconds for an orange rating. Everything else is rated red. Server-side rendering can significantly improve the LCP rating.
Time to interactive (TTI) is how long it takes before you can interact with the page using the mouse and keyboard. In React, this happens after the first complete render, when React has attached the event handlers. You want this to be less than 3.8 seconds to get a green rating. If you can get a TTI of 7.3 or less, you will be rated orange. Everything else is rated red. You can improve the TTI by deferring the loading of third-party JavaScript or by code splitting.1
Total blocking time (TBT) is the sum of all blocking tasks that occur between the FCP and TTI. A blocking task is anything that takes longer than 50 ms. That’s about how long it takes to display a frame in a movie, and anything longer than 50 ms starts to become noticeable. If you have too many blocking tasks, the browser will start to feel like it’s freezing up. For this reason, the grades for TBT cover short periods. If TBT is less than 300 ms, Lighthouse will grade your page as green. Anything up to 600 ms is orange, and everything else is graded red. A high TBT score will feel to the user like the browser is being overloaded. TBT is generally improved by running less JavaScript code or reducing the number of scans of the DOM. The most effective technique is probably code splitting.
Cumulative Layout Shift (CLS) is a measure of the jumpiness or visual stability of your web page. If your application inserts additional content that moves other content around during a page load, this will start to affect the CLS metric. The CLS is the proportion of the page that moves during loading.
Not included in the Lighthouse report is the First Input Delay (FID) metric, which is how long it takes between a user sending an event to the page—such as by clicking a button—and the JavaScript handler receiving the event. You want an FID of no more than 300 ms. The FID is closely related to the TBT because blocking events are typically created by event handlers.
As well as providing an audit of the primary metrics of your page, the Lighthouse report will also include advice for how to fix any problems it finds.
Lighthouse is an excellent starting point when checking for performance issues. It’s not an exhaustive check, but it will highlight problems that you might not otherwise notice.
Many factors (bandwidth, memory, CPU, and so on) can affect a Lighthouse audit, so expect your results to vary from run to run. Online services such as WebPageTest and GTmetrix can run audits on your application from various locations around the world, which will give you a more realistic view of your application’s speed than a Lighthouse audit running against http://localhost:3000.
While Lighthouse is good at highlighting the existence of performance problems, it’s less helpful at finding the cause of those problems. It might be that code for a web page is too large or too slow. It might be that the server is responding sluggishly. It might even be a resource problem, such as low memory or large cache size.
To find out why a bottleneck exists, we can next visit the performance tools of the browser itself.
If you are using Firefox or Chrome, you can get to the performance console by opening your page in an incognito window and then going to the Performance tab in the development tools (see Figure 10-4).
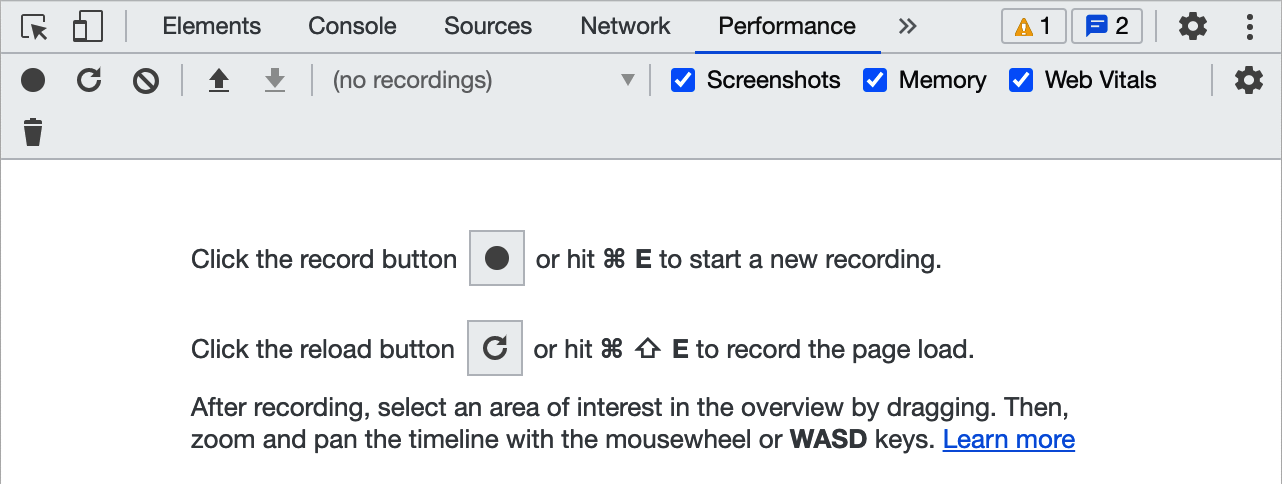
Figure 10-4. The Performance tab within the browser DevTools
The Performance tab is like the engine management system of the browser. There, you can track the memory usage, any CPU blockers, the number of elements within the DOM, and so on. To gather statistics, you will need to click the Record button on the toolbar and then interact with your page for a few seconds before stopping the recording. The performance system will trace everything you selected. In the example in Figure 10-5, you can see that a blocking operation (see TBT earlier) occurred when the user clicked a button, and the browser blocked for 60.92 ms until the event handler returned.
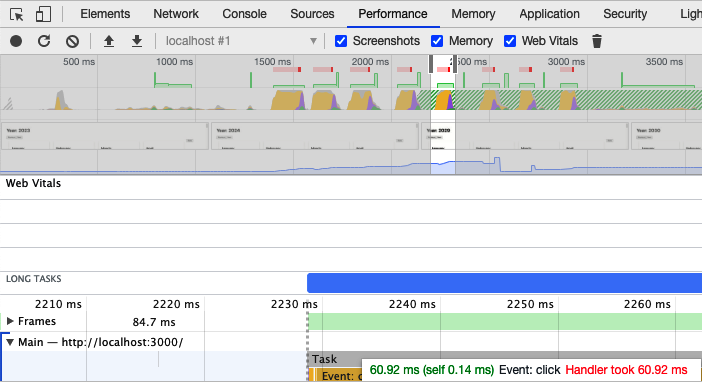
Figure 10-5. Zooming in to investigate a long-running task
The Performance tab gives you all the statistics you are ever likely to want when performance tuning. It probably has far more detail than you are ever likely to need. For that reason, you might want to install the React Developer Tools, which are available for Chrome and Firefox.
When you install the React Developer Tools, you may find that they cannot run in incognito mode by default. It’s worth enabling them to have access (see Figure 10-6 for Chrome and Figure 10-7 for Firefox).

Figure 10-6. Enabling React Dev Tools in incognito mode in Chrome
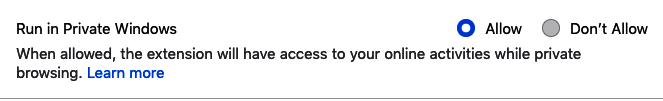
Figure 10-7. Enabling React Dev Tools in private mode in Firefox
In a similar way to the browser’s performance tools, the React Developer Tools need you to record a performance session by clicking the Record button in the top left of the developer panel (see Figure 10-8).
Figure 10-8. The React Profiler tab in Chrome DevTools
Once you have recorded a session, the performance statistics will be displayed and related to the React components that rendered the web page. If a component took a long time to display, you can hover over it in the performance results and see it highlighted on the page (see Figure 10-9).
The React Developer Tools are often the best interactive tool to identify the underlying cause of a performance issue. But, as ever, you should consider tuning performance only if a user or some higher-level tool such as Lighthouse discovers that a performance bottleneck exists.
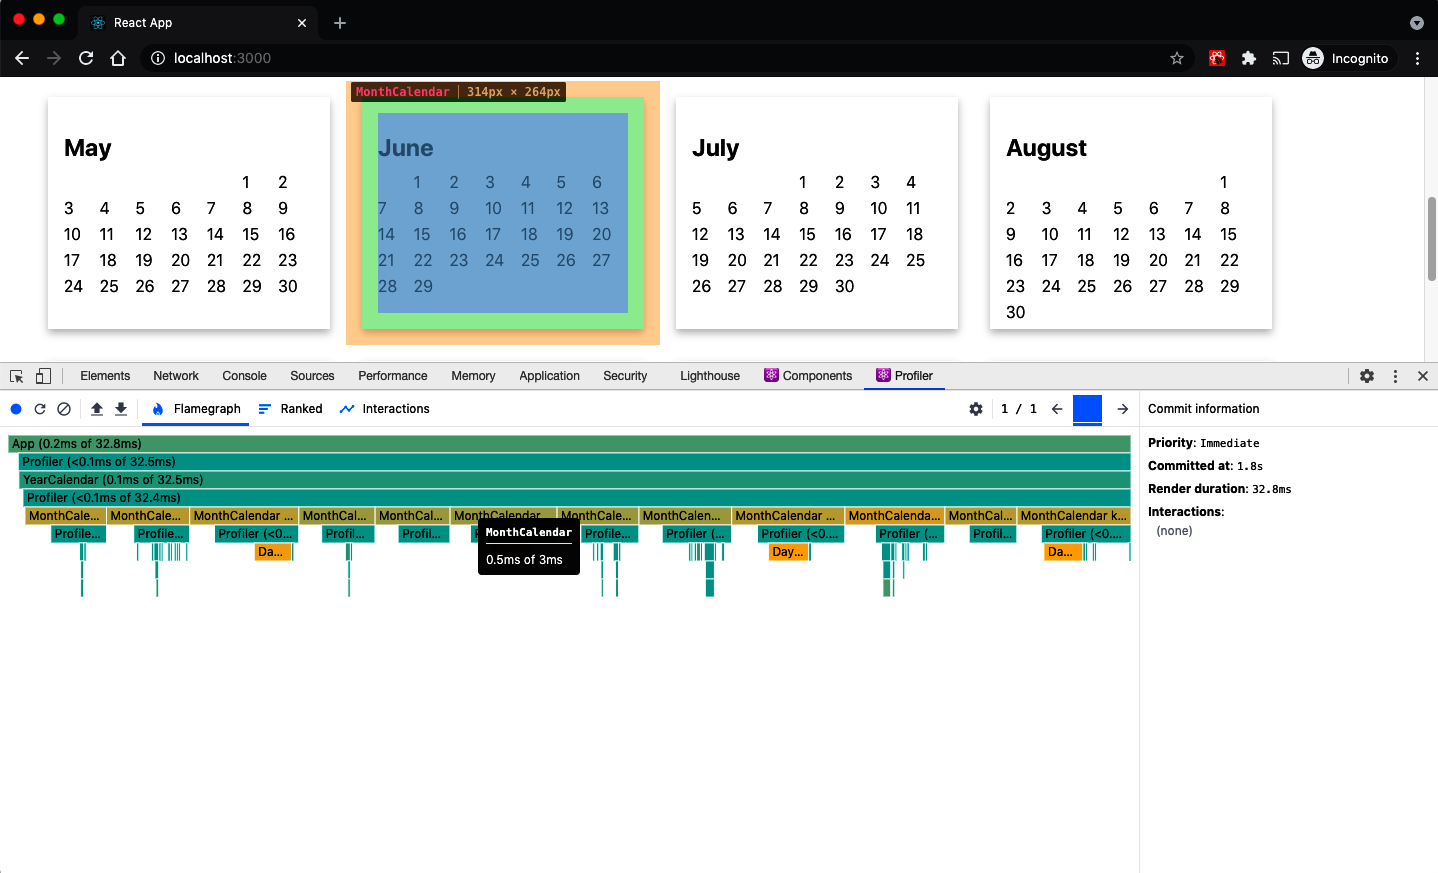
Figure 10-9. If you hover over a component in the flamegraph, it will be highlighted on the page
Track Rendering with Profiler
Problem
Browser tools provide a wealth of performance detail, and they should always be the first place you look to discover the cause of underlying performance problems.
Once you have identified a problem, it can be helpful to get more detailed performance statistics for a small part of the application. The only way to boost performance is by gathering actual performance figures before and after a change. That can be difficult to do with browser extensions because they will flood you with information about everything.
How do we get performance statistics for the part of the application we are tuning?
Solution
We are going to use the React Profiler component. You can wrap the Profiler component around any part of your application that you will
tune. It will record performance statistics whenever React renders it and will tell you several vital pieces of information:
| Statistic | Purpose |
|---|---|
Phase |
Whether a mount or an update caused the render |
Actual duration |
How long the render would take to complete if no internal caching was applied |
Base duration |
How long the render took with caching |
Start time |
The number of milliseconds since the page loaded |
Commit time |
When the results of the render find their way into the browser’s DOM |
Interactions |
Any event handlers that we are currently tracing |
To see how the Profiler component works, let’s start to examine the example application you can see in Figure 10-10.

Figure 10-10. The example Calendar application
This is the code for the App component:
import{useState}from'react'import{unstable_traceastrace}from'scheduler/tracing'import'./App.css'functionApp({onRender}){const[year,setYear]=useState(2023)return(<divclassName="App"><h1>Year:{year}</h1><buttononClick={()=>setYear((y)=>y-1)}>Previous</button><buttononClick={()=>setYear((y)=>y+1)}>Next</button><br/><YearCalendaryear={year}onRender={onRender}/></div>)}exportdefaultApp
The application displays two buttons: one for moving forward a year and one for moving back.
We can begin by wrapping the buttons and the calendar component in a Profiler component:
import{useState,Profiler}from'react'import{unstable_traceastrace}from'scheduler/tracing'import'./App.css'functionApp({onRender}){const[year,setYear]=useState(2023)return(<divclassName="App"><h1>Year:{year}</h1><Profilerid="app"onRender={()=>{}}><buttononClick={()=>setYear((y)=>y-1)}>Previous</button><buttononClick={()=>setYear((y)=>y+1)}>Next</button><br/><YearCalendaryear={year}onRender={onRender}/></Profiler></div>)}exportdefaultApp
The Profiler takes an id and a callback function onRender. Each time the Profiler is rendered, it sends back statistics to
the onRender function. So, let’s fill out the details of the onRender function a little more:
import{useState,Profiler}from'react'import{unstable_traceastrace}from'scheduler/tracing'import'./App.css'letrenders=[]lettracker=(id,phase,actualDuration,baseDuration,startTime,commitTime,interactions)=>{renders.push({id,phase,actualDuration,baseDuration,startTime,commitTime,interactions:JSON.stringify(Array.from(interactions)),})}functionApp({onRender}){const[year,setYear]=useState(2023)return(<div>....<Profilerid="app"onRender={tracker}>....</Profiler><buttononClick={()=>console.table(renders)}>Stats</button></div>)}
The tracker function will record each of the results from the Profiler in an array called renders. We’ve also added a button to
the interface, which will display the renders in the console in tabular format whenever we click it.
If we reload the page and click the Previous and Next buttons a few times, followed by the Stats button, we will see the profile statistics on the console (see Figure 10-11).
The data is in tabular format, which makes it a little easier to read. It also means that we can sort by any of the columns. We can also copy the entire table and paste it into a spreadsheet for more analysis.
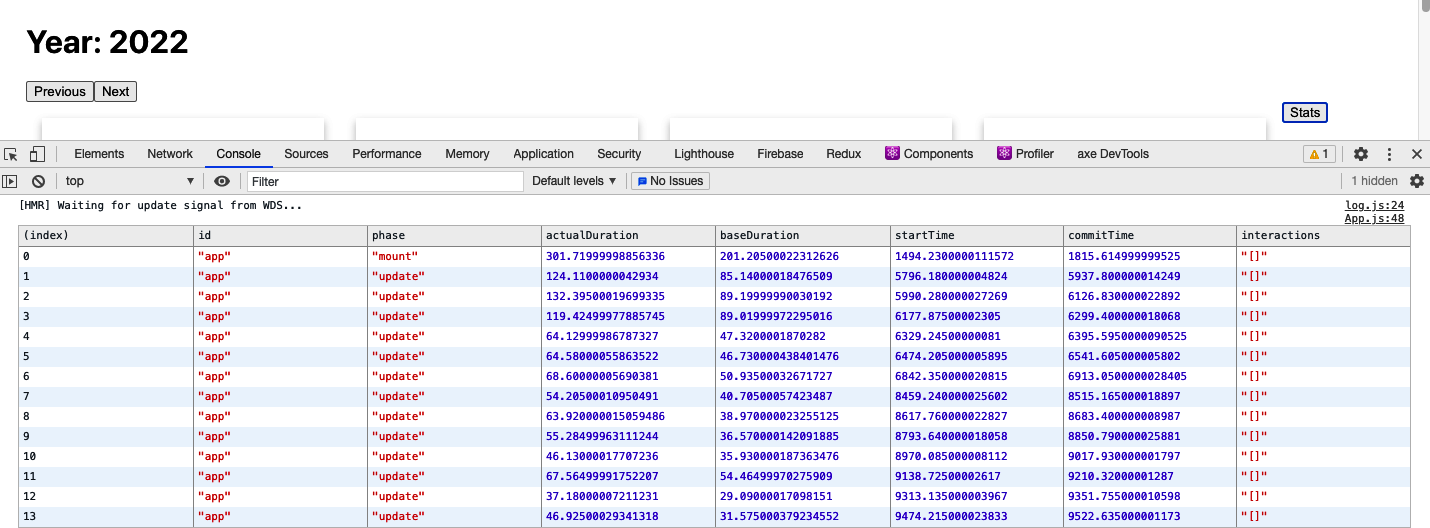
Figure 10-11. The render statistics displayed in the JavaScript console
You will notice that the interactions column is always an empty array. That’s because we are not currently tracking any event handlers or other pieces of code. If we want to see which event handlers are currently running during a render, we can import a tracing function and wrap it around any piece of code that we want to track. For example, this is how we can start to track the user clicking the Previous button:
import{unstable_traceastrace}from'scheduler/tracing'...<buttononClick={()=>{trace('previous button click',performance.now(),()=>{setYear((y)=>y-1)})}}/>
The trace function takes a label, a timestamp, and a callback containing the code it is tracing. The timestamp could be a date,
but it is often better to use the milliseconds returned from performance.now().
If we reload the web page, click Next a few times, and then click Previous a few times, we will start to see the interactions appearing in the table of results (see Figure 10-12).
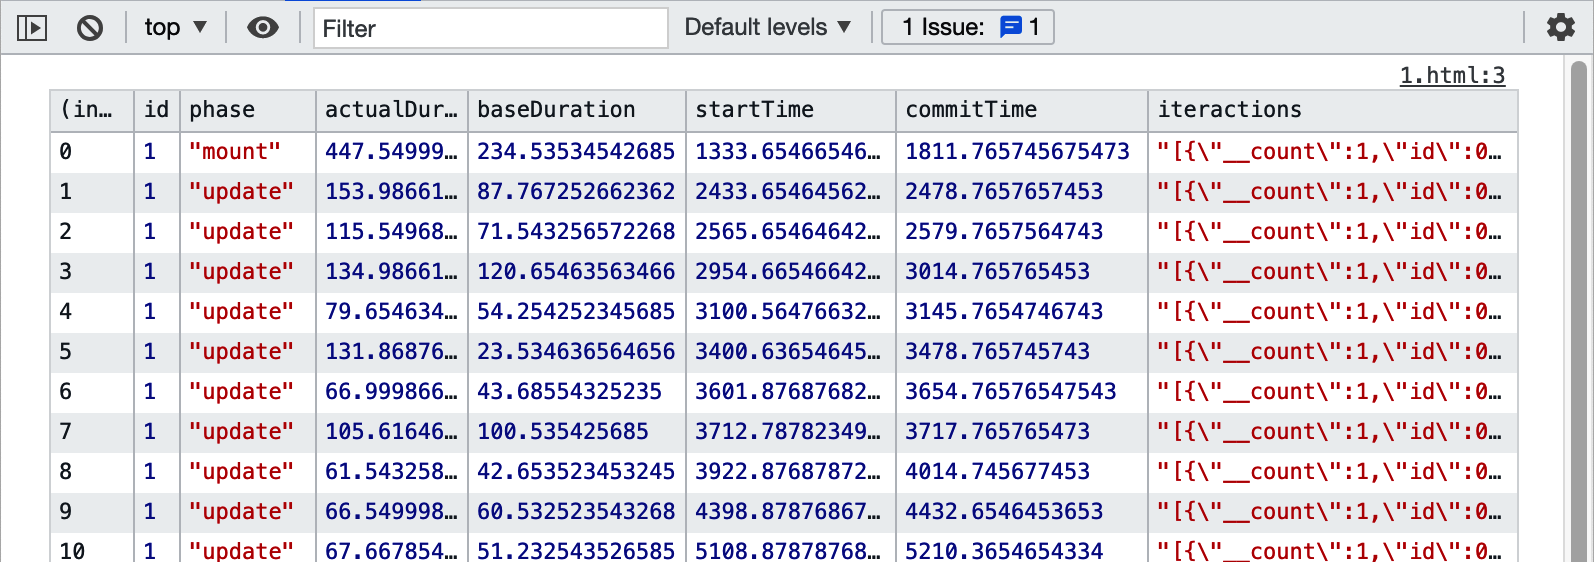
Figure 10-12. Traced interactions are shown as JSON strings within the results table
We stringify the output because trace stores interactions as JavaScript sets, which often don’t display correctly in the console.
Even though the interaction data looks truncated in the table, you can still copy the results. Here is the example of the data
returned by a single trace interaction:
[{"__count":1,"id":1,"name":"previous button click","timestamp":4447.909999988042}]
Discussion
The Profiler component has been in React since version 16.4.3. The trace function is still experimental, but it is tremendously
powerful. Although we are using it for only a simple event handler in our example, it can also provide real-world timing for
larger pieces of code, such as network requests. React container components will often have many network requests “in-flight” during
a render, and the trace function gives you the ability to see what was going on at the time of a particularly slow render. It will
also give you some idea of how many renders resulted from a whole chain of different network processes.
You can download the source for this recipe from the GitHub site.
Create Profiler Unit Tests
Problem
The React Profiler is a powerful tool. It gives you access to the same profiling information that is available within the React
Developer Tools. It has the advantage that you can focus on the code that you are trying to optimize.
However, it still relies on the interactions that you make with the web page. You will want to test performance before and after you make a code change. But how can you be sure that the timings you take before and after are measuring the same things? If you perform a manual test, how can you guarantee that you will perform the same set of actions each time?
Solution
This recipe will look at how to create unit tests that call the Profiler code. Automated tests will allow us to create repeatable
performance tests that we can run to check that any optimizations we make are having a real impact on performance.
In a unit test, we can render a React component outside of a web browser because the Testing Library provides a headless implementation of the DOM.
To see how to use the Profiler, we will take another look at the example calendar application (see Figure 10-13).
Figure 10-13. The example Calendar application
We can add a Profiler component to the main code for the App component and then allow any other code to pass in an onRender method that can be used to track render performance:
import{useState,Profiler}from'react'importYearCalendarfrom'./YearCalendar'import{unstable_traceastrace}from'scheduler/tracing'import'./App.css'functionApp({onRender}){const[year,setYear]=useState(2023)return(<divclassName="App"><h1>Year:{year}</h1><Profilerid="app"onRender={onRender||(()=>{})}><buttononClick={()=>{trace('previous button click',performance.now(),()=>{setYear((y)=>y-1)})}}>Previous</button><buttononClick={()=>setYear((y)=>y+1)}>Next</button><br/><YearCalendaryear={year}onRender={onRender}/></Profiler></div>)}exportdefaultApp
We can also pass the onRender function down to child components to track their render performance. In the preceding code, we’re
passing onRender to YearCalendar, which can then use it in its own Profiler component or pass it further down the component
tree.
You can avoid the need to pass the onRender to child components by creating a provider component that will inject the
onRender into the current context. We are not doing that here to keep the code simple. But there are various other examples using
providers elsewhere in the book. For example, see the SecurityProvider in “Secure Requests, Not Routes”.
The Profiler component must be given an id property and an onRender property. When the application is run normally, no
onRender property will be passed to the App component, so we need to provide a default function:
<Profilerid='app'onRender={onRender||(()=>{})}>
The Profiler component is relatively lightweight and does not generally slow down the application’s performance. If you
forget to remove the Profiler from your code, it won’t matter. The
Profiler runs only in development mode. It will be removed
from the code when you create a production build.
We can now start to build a unit test:
import{render,screen}from'@testing-library/react'importuserfrom'@testing-library/user-event'importAppfrom'./App'letrenders=[]lettracker=(id,phase,actualDuration,baseDuration,startTime,commitTime,interactions)=>{renders.push({id,phase,actualDuration,baseDuration,startTime,commitTime,interactions:JSON.stringify(Array.from(interactions)),})}letstartTime=0describe('App',()=>{beforeEach(()=>{renders=[]startTime=performance.now()})afterEach(()=>{console.log('Time taken: ',performance.now()-startTime)console.table(renders)})it('should move between years',async()=>{render(<ApponRender={tracker}/>)user.click(screen.getByRole('button',{name:/previous/i}))user.click(screen.getByRole('button',{name:/previous/i}))user.click(screen.getByRole('button',{name:/previous/i}))user.click(screen.getByRole('button',{name:/next/i}))user.click(screen.getByRole('button',{name:/next/i}))user.click(screen.getByRole('button',{name:/next/i}))},30000)})
Tests that last longer than five seconds are likely to breach the Jest timeout limit. The easiest way to avoid this limit is
by adding a timeout parameter to the it function call, as we do here, to set the timeout to 30,000 ms. You will need to adjust
this value according to the complexity of your test.
When you run this test, an enormous amount of data is captured in the console (see Figure 10-14).
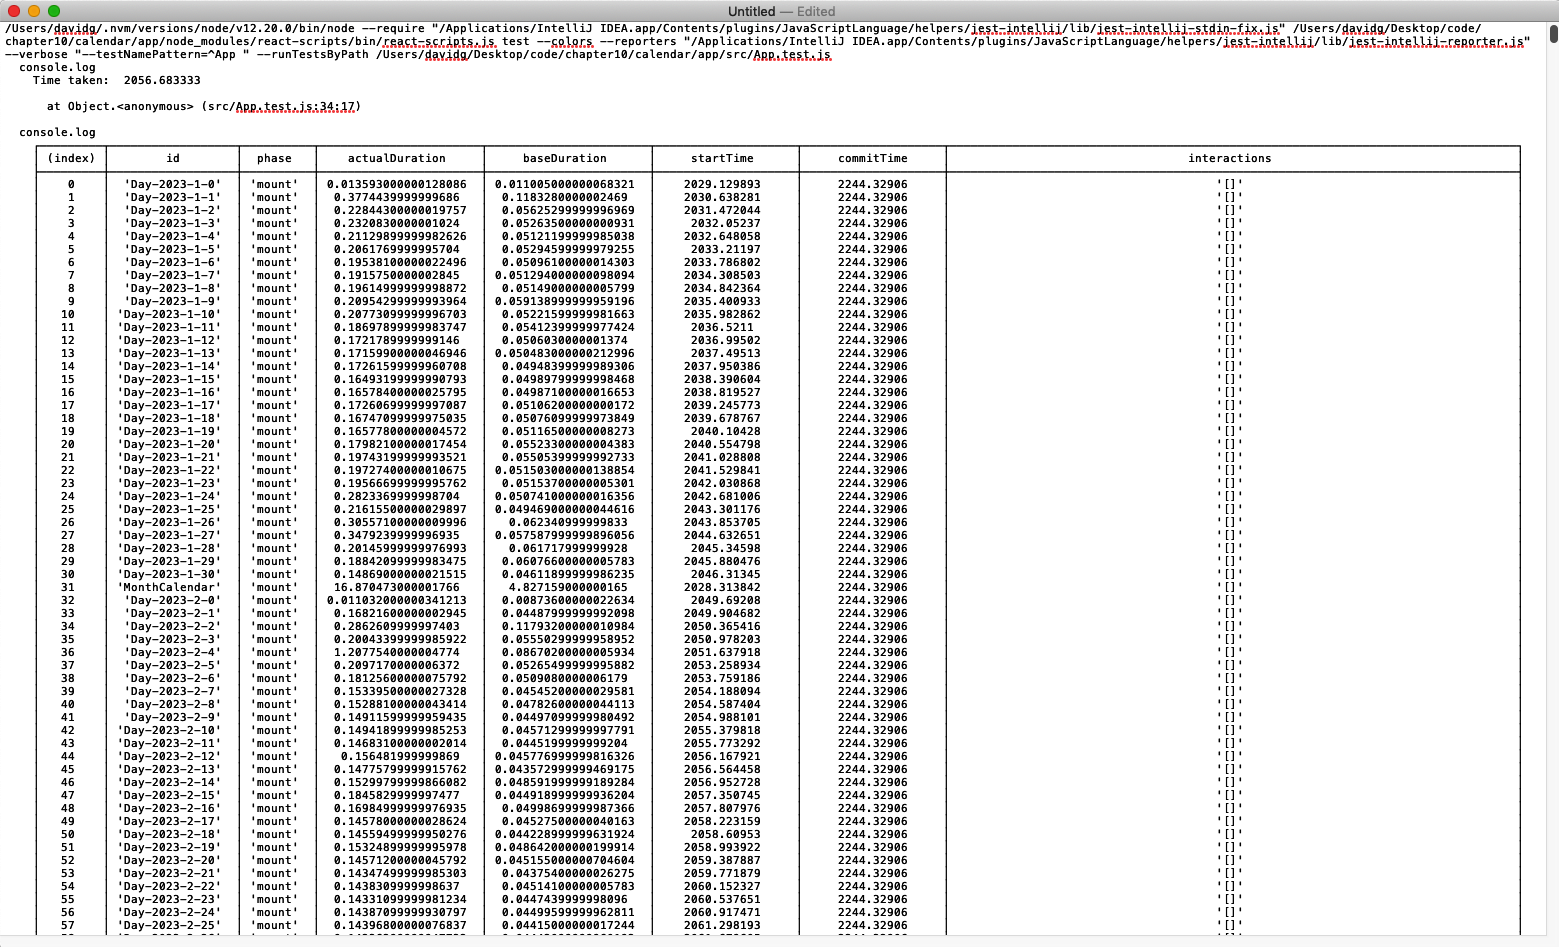
Figure 10-14. The unit test will capture an enormous amount of rendering information
Notably, the test is repeatable. It will perform the same actions each time. We’ve found that unit tests tend to be far more consistent than code run in the browser. Repeated runs of the previous test gave overall times of 2,100 ms +/– 20 ms. That’s a variation of less than 1%. They also produced exactly 2,653 profile scores each time.
It’s unlikely that we’d get repeatable results in a browser with a manual test.
In the example here, we are simply displaying the capture results. In an actual performance situation, you might want to process the results in some way to find the average render time of a particular component, for example. Then, when you start to tune the component, you can be more confident that any performance gains result from actual performance changes rather than variations in the browser’s behavior.
Discussion
Even though we are writing this performance testing code in a Jest unit test, it is not a test in the same way that a regular functional test is; we are not performing any assertions. Assertions can still be helpful,2 but it is not good to write performance tests that assert that some operation is faster than a given time. Performance tests are highly dependent upon the environment. If you write a test on a development that asserts that something will take less than three seconds, you should not be surprised if it fails on an integration server, where it took nine seconds.
If you do want to track performance automatically, you might consider adding regression checks. A regression check will record a set of performance statistics in some central repository and record the ID of the environment that produced them. You can check that future runs in the same environment are not significantly slower than historic runs in the same environment.
In general, though, it is better to report performance results rather than assert what you want the performance to be.
You can download the source for this recipe from the GitHub site.
Measure Time Precisely
Problem
Once you get to the point where you need to optimize quite low-level JavaScript code, what should you use to measure performance?
You could, for example, use the Date() function to create a timestamp at the start and end of some JavaScript code:
constbeforeDate=newDate()for(leti=0;i<1000;i++){}constafterDate=newDate()console.log('1,000 loops took',afterDate.getTime()-beforeDate.getTime())
We can convert each date into milliseconds, so we can see how long it takes if we subtract one date from another.
This was such a common technique that the console object was given to new methods called time and timeEnd, to make the code
shorter:
console.time('1,000 loops')for(leti=0;i<1000;i++){}console.timeEnd('1,000 loops')
The time function accepts a label parameter, and if we call timeEnd with the same label, it displays the results on the console.
Let’s run the code:
1,000 loops: 0msThat’s a problem. React applications rarely contain long-running functions, so you typically need to optimize small pieces of
JavaScript code only if the browser calls them many times. For example, you might want to optimize game code that is rendering
animation on a screen. It can be hard to measure short pieces of code because they might run in less than a millisecond. We can’t
measure the performance with Date objects because they resolve down to the millisecond only, even though the machine’s internal
clock is far more precise than that.
We need something that we can use for measuring times of less than a millisecond.
Solution
We are going to use performance.now(). This function call returns a high-resolution timestamp measured in fractions of
milliseconds. For example, if you open the Chrome console and type performance.now(), you will see something like this:
>performance.now()<10131.62500000908
The time is measured differently from the time in JavaScript dates. JavaScript dates measure time from January 1, 1970. Instead,
performance.now() measures time from when the current web page loaded.3
An interesting thing happens if you try to run performance.now() inside Firefox:
>performance.now()<4194
By default, Firefox will return only whole numbers of milliseconds for
performance.now(), effectively removing most of the
advantages of using it. Firefox rounds to the whole milliseconds because of security. Technically, if JavaScript can time tiny
amounts of code precisely, this can provide a signature for the browser.
You can enable high-resolution time within Firefox by opening about:config, searching for the property called
privacy.reduceTimerPrecision, and setting it to false. If you do this, you will start to get high-resolution times:
performance.now()151405.8
Be sure you disable this property if you want to avoid third parties using it to track you.
To go back to our example code, we can measure the time taken to perform loops like this:
constbefore0=performance.now()for(leti=0;i<1000;i++){}constafter0=performance.now()console.log('1,000 loops took',after0-before0)constbefore1=performance.now()for(leti=0;i<100000;i++){}constafter1=performance.now()console.log('100,000 loops took',after1-before1)
When we run this code, we see the following:
1,000 loops took 0.03576700000007804100,000 loops took 1.6972319999999854
These answers are far more precise and provide more information about the underlying performance of JavaScript. In this case, we can see that adding more iterations to a loop does not scale linearly, which suggests that the JavaScript engine starts to optimize the code on the fly once it realizes that each of the loop iterations is the same.
Discussion
performance.now() has several advantages over JavaScript dates. Aside from the additional precision, it is unaffected by
clock changes, which is good if you decide to add some performance monitoring to long-running code. It also starts at zero when the
page starts to load, which is useful for optimizing page load times.
One word of caution when using performance.now(): be wary of using it to build some higher-level timing function. For example, we
once created a simple JavaScript generator function to make it a little easier to use performance.now():
function*timekeeper(){letnow=0while(true)yield-now+(now=performance.now())}
This function was created to avoid the need to calculate the difference between start and end times. Instead of writing this:
constbefore0=performance.now()for(leti=0;i<1000;i++){}constafter0=performance.now()console.log('1,000 loops took',after0-before0)constbefore1=performance.now()for(leti=0;i<100000;i++){}constafter1=performance.now()console.log('100,000 loops took',after1-before1)
we could instead write this:
constt=timekeeper()t.next()for(leti=0;i<1000;i++){}console.log('1,000 loops took',t.next().value)for(leti=0;i<100000;i++){}console.log('100,000 loops took',t.next().value)
No need for all of those ugly before and after variables. The time would reset to zero after each call to t.next().value,
doing away with the need for the calculation.
The problem? The act of wrapping the performance.now() call inside another function adds a significant amount of time to the
measure, destroying the precision of performance.now():
1,000 loops took 0.05978800000002593100,000 loops took 19.585223999999926
In this case, even though it takes only 1.69 ms to run 100,000 loops, the function reports the time as over 19 ms.
Never hide a call to performance.now() inside another function if you want it to be accurate.
You can download the source for this recipe from the GitHub site.
Shrink Your App with Code Splitting
Problem
One of the biggest drains on performance for an SPA is the amount of JavaScript code that needs to be downloaded and run. Not only does the JavaScript take time to render, but the amount of network bandwidth required can slow your app down significantly on devices connected to a mobile network.
Let’s consider the synchronized routes application we used in Chapter 2 (see Figure 10-15).
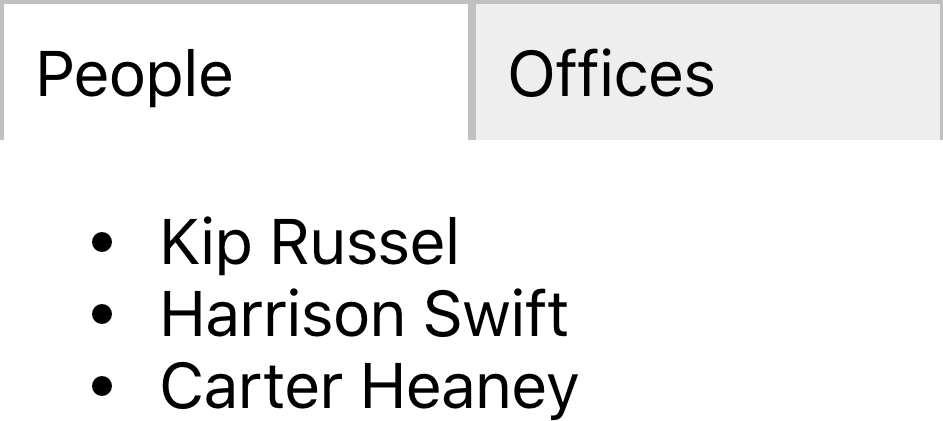
Figure 10-15. The synchronized routes application
The example application is tiny, but it contains some quite large JavaScript bundles:
$ ls -l build/static/jstotal 1336-rw-r--r-- 1 davidg admin 161800 12:07 2.4db4d779.chunk.js-rw-r--r-- 1 davidg admin 1290 12:07 2.4db4d779.chunk.js.LICENSE.txt-rw-r--r-- 1 davidg admin 461100 12:07 2.4db4d779.chunk.js.map-rw-r--r-- 1 davidg admin 4206 12:07 3.307a63d5.chunk.js-rw-r--r-- 1 davidg admin 9268 12:07 3.307a63d5.chunk.js.map-rw-r--r-- 1 davidg admin 3082 12:07 main.e8a3e1cb.chunk.js-rw-r--r-- 1 davidg admin 6001 12:07 main.e8a3e1cb.chunk.js.map-rw-r--r-- 1 davidg admin 2348 12:07 runtime-main.67df5f2e.js-rw-r--r-- 1 davidg admin 12467 12:07 runtime-main.67df5f2e.js.map$
The largest (2.4db4d779.chunk.js) contains the main React framework code, and the app-specific code is limited to the small main.e8a3e1cb.chunk.js file. That means this application is about as small as a React application can be. Most React applications will be significantly larger: often totaling 1 Mb in size, which will be a significant problem for users on slow connections.
So, what can we do to reduce the size of JavaScript bundles in React?
Solution
We will use code splitting, which involves breaking the main code for our application into several smaller bundles. The browser will then load these bundles lazily. A particular bundle will load only when one of the components it contains is needed.
The example application we are using for this recipe is most certainly not one that requires code splitting. As with all performance changes, you should only really try to split your code if doing so makes a significant change to web performance. We will split the code in this application because it will be easier to see how it works.
We split code in React with a function called lazy:
import{lazy}from'react'
The lazy function accepts a factory function, which, when called, will import a component. The lazy function returns a
placeholder component, which will do nothing until the browser renders it. The placeholder component will run the factory function
and dynamically load whichever bundle contains the actual component.
To see how this works, consider this component from our example application:
import{NavLink,Redirect,Route,Switch}from'react-router-dom'importPeoplefrom'./People'importOfficesfrom'./Offices'import'./About.css'constAbout=()=>(<divclassName="About"><divclassName="About-tabs"><NavLinkto="/about/people"className="About-tab"activeClassName="active">People</NavLink><NavLinkto="/about/offices"className="About-tab"activeClassName="active">Offices</NavLink></div><Switch><Routepath="/about/people"><People/></Route><Routepath="/about/offices"><Offices/></Route><Redirectto="/about/people"/></Switch></div>)exportdefaultAbout
The browser will render the People and Offices components only when the user visits a given route. If the application is
currently on the path /about/people, the Offices component will not render, which means that we could potentially delay
loading the Offices component until later. We can do this with the lazy function.
We’ll replace the import of the Offices component with a call to lazy:
//import Offices from "./Offices"constOffices=lazy(()=>import('./Offices'))
The object now stored in the Offices variable will appear to the rest of the application as just another component. It’s a lazy
placeholder. Internally it contains a reference to the factory function, which it will call when the browser renders it.
If we try to refresh the web page, we will see an error (see Figure 10-16).
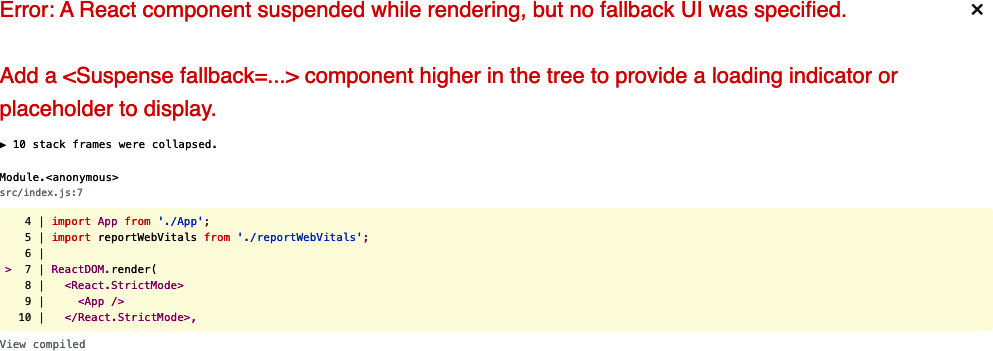
Figure 10-16. You will get a lazy loading error if you forget to add a Suspense component
The placeholder will not wait for the actual component to load before returning. Instead, it will substitute some other HTML while it is waiting for the actual component to load.
We can set this “loading” interface with the Suspense container:
import{lazy,Suspense}from'react'import{NavLink,Redirect,Route,Switch}from'react-router-dom'importPeoplefrom'./People'// import Offices from './Offices'import'./About.css'constOffices=lazy(()=>import('./Offices'))constAbout=()=>(<divclassName="About"><divclassName="About-tabs"><NavLinkto="/about/people"className="About-tab"activeClassName="active">People</NavLink><NavLinkto="/about/offices"className="About-tab"activeClassName="active">Offices</NavLink></div><Suspensefallback={<div>Loading...</div>}><Switch><Routepath="/about/people"><People/></Route><Routepath="/about/offices"><Offices/></Route><Redirectto="/about/people"/></Switch></Suspense></div>)exportdefaultAbout
The lazy placeholder will check its context to find the fallback component provided by Suspense, and it will display this on
the page while waiting for the additional JavaScript bundle to load.
We are using a simple “Loading…” message here, but there’s no reason why you can’t instead show some fake replacement interface to give the impression that the new component has loaded before it has. YouTube uses the same technique on its front page. When YouTube is loading content, it displays a set of blocks and rectangles in place of the videos it’s about to load (see Figure 10-17). Videos will often take two to three seconds to load, but this technique gives the user the impression that they load instantly.

Figure 10-17. YouTube renders a fake front page while loading recommendations
In our application, if you refresh the page now, you should see the application go back to normal, as shown in Figure 10-18.
Figure 10-18. Adding a Suspense component removes the error
Behind the scenes, the Webpack development server will split off the Offices code into a separate JavaScript bundle.
Webpack will also split out the bundles when you generate a build. It will use tree shaking to identify which components can safely appear in which JavaScript bundles.
Tree shaking is a process that recursively analyzes which code files are imported by other files, starting from some
initial file, such as index.js. This allows Webpack to avoid adding code into a bundle that is never imported by any other code.
The calls to React.lazy will not be tracked by the tree shaking process, and so the lazily loaded code will not be included in the
initial JavaScript bundle. Webpack will instead run a separate tree shaking process for each lazily loaded file, which will result
in a large number of small code bundles in the production application.
If we generate a new build and then look at the generated JavaScript code, we will now see some extra files:
$ yarn build...Builds code$ ls -l build/static/jstotal 1352-rw-r--r-- 1 davidg admin 628 12:09 0.a30b3768.chunk.js-rw-r--r-- 1 davidg admin 599 12:09 0.a30b3768.chunk.js.map-rw-r--r-- 1 davidg admin 161801 12:09 3.f7664178.chunk.js-rw-r--r-- 1 davidg admin 1290 12:09 3.f7664178.chunk.js.LICENSE.txt-rw-r--r-- 1 davidg admin 461100 12:09 3.f7664178.chunk.js.map-rw-r--r-- 1 davidg admin 4206 12:09 4.a74be2bf.chunk.js-rw-r--r-- 1 davidg admin 9268 12:09 4.a74be2bf.chunk.js.map-rw-r--r-- 1 davidg admin 3095 12:09 main.e4de2e45.chunk.js-rw-r--r-- 1 davidg admin 6089 12:09 main.e4de2e45.chunk.js.map-rw-r--r-- 1 davidg admin 2361 12:09 runtime-main.9df06006.js-rw-r--r-- 1 davidg admin 12496 12:09 runtime-main.9df06006.js.map
Because this is such a small application, this is unlikely to affect the performance, but let’s check anyway.
Loading performance is easiest to check using Chrome’s Lighthouse tool. You can see the performance of the original version of this application in Figure 10-19.
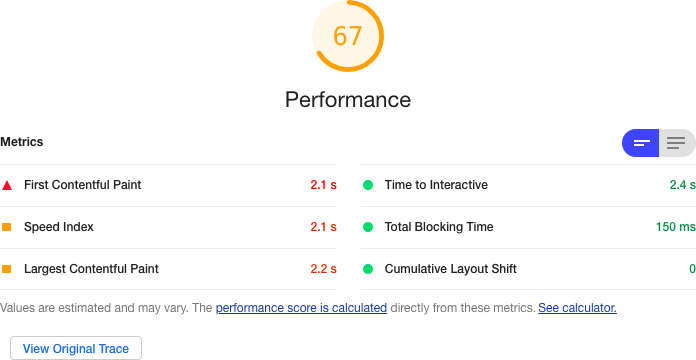
Figure 10-19. The application’s performance without code splitting
If we add some lazy loading, we do get a slight performance increase, primarily because of the time taken to complete the FCP (see Figure 10-20).
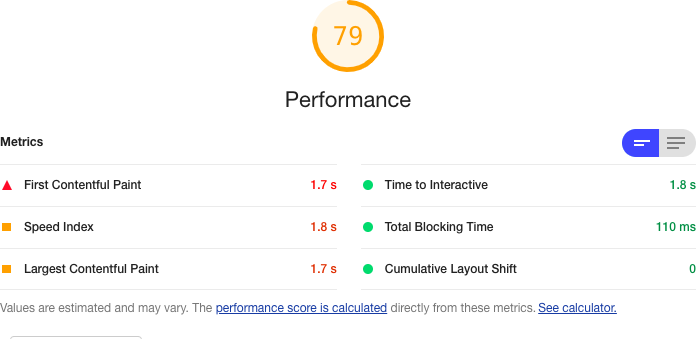
Figure 10-20. The application’s performance with code splitting
It’s not a massive increase in performance, but it does indicate that you can get some benefit from lazy loading even in tiny applications.
Discussion
All optimizations have a price, but code splitting takes minimal effort to implement, and it’s the one that we find we use most often. It will often improve web-vitals metrics for FCP and TTI. You should avoid using it too aggressively because the framework needs to do more work to download and evaluate each of the scripts. But for most reasonably large applications, you will get some immediate benefit from splitting the code.
It is often best to split code at the route level. Routes control which components are visible and so are a good place to divide the code you need to load now from the code you need to load later. It will also mean that if anyone bookmarks a location in your application, they will only download the code required for that location when they return to it.
You can download the source for this recipe from the GitHub site.
Combine Network Promises
Problem
Many React applications make asynchronous network calls, and a lot of application lethargy results from waiting for responses to those asynchronous requests. The application is probably doing very little during those calls, so the application is not busy; it’s just waiting.
Over time, client applications have become more complex, and server APIs have become simpler. In the case of serverless applications, the server APIs are so generic that no custom code is required, which leads to an increase in the number of API calls that the client code makes.4
Let’s look at an example. We have an application that reads the details of several people from a backend API. The server has an
end point that, if a browser sends a GET request to /people/1234, will return the details of a person with the id of 1234. The
developer has written a hook to make these requests:
import{useEffect,useState}from'react'import{get}from'./fakeios'constusePeopleSlow=(...ids)=>{const[people,setPeople]=useState([])useEffect(()=>{letdidCancel=false;(async()=>{constresult=[]for(leti=0;i<ids.length;i++){constid=ids[i]result.push(awaitget('/people/'+id))}if(!didCancel){setPeople(result)}})()return()=>{didCancel=true}// eslint-disable-next-line react-hooks/exhaustive-deps},[...ids])returnpeople}exportdefaultusePeopleSlow
The hook is called like this:
constpeopleSlow=usePeopleSlow(1,2,3,4)
The code calls the server for each ID. It waits for each response to complete before storing the results in an array. If the API
endpoint takes 5 seconds to respond, the usePeopleSlow hook will take 20 seconds to return all of the data.
Is there anything we can do to speed things up?
Solution
We will combine asynchronous promises so that multiple API requests can be in flight at the same time.
Most asynchronous request libraries work by returning promises. If you wait for a promise, it will return the payload of the
response. But in the example usePeopleSlow code earlier, these promises are waited for in sequence:
constresult=[]for(leti=0;i<ids.length;i++){constid=ids[i]result.push(awaitget('/people/'+id))}
The request for the second person is not even sent until the response for the first person is received, which is why a 5-second delay results in a 20-second response time when we are reading the details of four people.
There is another way we can do this. We could send the requests without waiting and have all of them in-flight simultaneously. We then need to wait for all the responses, and when we receive the last one, we can return the data from the hook.
You can make parallel requests with a JavaScript function called Promise.all.
The Promise.all function accepts a list of promises and combines them into a single promise. That means we could combine
several get() calls like this:
const[res1,res2,res3]=awaitPromise.all(get('/people/1'),get('/people/2'),get('/people/3'))
Promise.all combines not just promises, but also results. If you wait for an array of promises with Promise.all, you will receive an array containing each of the
promises.
We can now write a new version of the usePeopleSlow hook, using Promise.all:
import{useEffect,useState}from'react'import{get}from'./fakeios'constusePeopleFast=(...ids)=>{const[people,setPeople]=useState([])useEffect(()=>{letdidCancel=false;(async()=>{constresult=awaitPromise.all(ids.map((id)=>get('/people/'+id)))if(!didCancel){setPeople(result)}})()return()=>{didCancel=true}// eslint-disable-next-line react-hooks/exhaustive-deps},[...ids])returnpeople}exportdefaultusePeopleFast
The key to this code is these three lines:
constresult=awaitPromise.all(ids.map((id)=>get('/people/'+id)))
By mapping the ids into an array of the promises returned by network requests, we can wait for the Promise.all result and receive an array of all the responses.
If you time the two hooks, then usePeopleFast will read the details of four people in just over five seconds. Effectively, we have
made five requests in the time taken to make one. In the example application, these were the comparative timings of the two versions
of the code:
| Version | Time Taken (ms) |
|---|---|
usePeopleSlow |
5000.99999998929 |
usePeopleFast |
20011.224999994738 |
Discussion
This approach will significantly improve performance if you have multiple independent asynchronous requests. If you make many parallel requests, then the browser, the network card, or the server might start to queue responses. However, it will still generate a response more rapidly than a series of independent responses.
If you send parallel requests, it will intensify the load on the server, but this is unlikely to be a huge issue. First, as we just noted, servers often queue requests when they are busy. Second, the server will still be performing the same total amount of work. All you are doing is concentrating that work into a shorter period.
You can download the source for this recipe from the GitHub site.
Use Server-Side Rendering
Problem
SPAs do a great job of making websites as feature-rich as desktop applications. If you use an application like Google Docs, the experience is almost indistinguishable from using a desktop word processor.
But all things come at a price. One of the major performance issues for SPAs is that the browser has to download a large bundle of
JavaScript code before it can build an interface. If you create a React application with a tool like create-react-app, the only
thing you will have in the body of the HTML is an empty DIV called root:
<divid="root"></div>
That empty DIV is all the browser will see until the JavaScript engine downloads the code, runs it, and updates the DOM.
Even if we reduce the bundle size with code splitting and the browser has cached the JavaScript, it can still take a couple of seconds to read the code and set up the interface.
Building the entire interface from JavaScript means that SPAs typically suffer from two main issues. First, and most important, the user experience can degrade, particularly for large React applications. Second, your application will have poor search engine optimization (SEO). Search engine robots will often not wait for the JavaScript to render an interface when scanning your site. They will download the basic HTML of the page and index its contents. For many business applications, this might not matter. But if you are building, say, a shopping site, you will probably want as many of the pages indexed as possible to capture passing traffic.
Therefore, it would be helpful if, instead of displaying an empty DIV when the HTML is loaded, we could begin by including the
initial HTML of our page before the browser downloads and runs the application’s JavaScript.
Solution
We will look at using server-side rendering to replace the empty DIV of a React page with a prerendered HTML version. We’ll be
able to do this because of the way that React interacts with the DOM of a web page.
When you render a component in React, you are not directly updating the DOM. Instead, when you run a piece of code like this:
ReactDOM.render(<React.StrictMode><App/></React.StrictMode>,document.getElementById('root'))
the render method updates a virtual DOM, which, at intervals, we will synchronize with the actual HTML elements on the page. React
does this efficiently, so it will only update elements in the real DOM that don’t match the elements in the virtual DOM.
Server-side rendering works by rendering not to the React virtual DOM, but to a string. When the browser sends a request for the HTML page to the server, we will render a version of the React contents to a string and then insert that string into the HTML, before returning it to the browser. This means that the browser will immediately render HTML of the page before it even starts to download the JavaScript of the application. Our server-side code will look something like this:
letindexHTML=<contentsofindex.html>constapp=<renderApptostring>indexHTML=indexHTML.replace('<div id="root"></div>',`<divid="app">${app}</div>`)res.contentType('text/html')res.status(200)returnres.send(indexHTML)
Let’s begin by creating an application with create-react-app to see how this works in more detail.
There are many React tools and frameworks that support server-side rendering. create-react-app is not one of those tools. So looking at how to convert a create-react-app application will allow us to understand all the steps required to enable SSR in React:
$ npx create-react-app ssrappWe’ll be building a server to host the SSR code. Let’s start by creating a folder for the server code:
$ mkdir serverWe’ll build the server using Express. Our server code will be rendering the components of our application.
We’ll need some additional libraries that will be useful when loading the React components. In the main application directory (not the server subdirectory), install the following:
$ npm install --save-dev ignore-styles url-loader @babel/registerThe create-react-app tool generates code that uses a lot of modern JavaScript features that are not available out of the box, so the first thing we’ll need to do in our server code is enable those JavaScript features for the server to run our React
components. Within the new server folder, create a file called index.js and put this into it:
require('ignore-styles')require('url-loader')require('file-loader')require('regenerator-runtime/runtime')require('@babel/register')({ignore:[/(node_modules)/],presets:['@babel/preset-env',['@babel/preset-react',{runtime:'automatic',},],],plugins:[],})require('./ssr')
This file will configure language features that we are going to use in the server code. We’re loading the preset-react Babel
plugin that is installed automatically in every create-react-app application. At the end of the script, we load a file called
ssr.js, where we’ll put our main server code.
Create the server/ssr.js file and add the following code to it:
importexpressfrom'express'importfsfrom'fs'importpathfrom'path'constserver=express()server.get(/.(js|css|map|ico|svg|png)$/,express.static(path.resolve(__dirname,'../build')))server.use('*',async(req,res)=>{letindexHTML=fs.readFileSync(path.resolve(__dirname,'../build/index.html'),{encoding:'utf8',})res.contentType('text/html')res.status(200)returnres.send(indexHTML)})server.listen(8000,()=>{console.log(`Launchedathttp://localhost:8000!`)})
Our custom server will work similarly to the development server that comes with create-react-app. It creates a web server with
this line:
constserver=express()
If the server receives a request for a JavaScript, stylesheet, or image file, it will look for the file in the build directory.
The build directory is where create-react-app generates the deployable version of our application:
server.get(/.(js|css|map|ico|svg|png)$/,express.static(path.resolve(__dirname,'../build')))
If we receive a request for anything else, we will return the contents of the build/index.html file:
server.use('*',async(req,res)=>{...})
Finally, we start the server running on port 8000:
server.listen(8000,()=>{console.log(`Launchedathttp://localhost:8000!`)})
Before we can run this server, we need to build the application. We can do this with the following command:
$ yarn run buildBuilding the application generates all of the static files in the build directory that our server will need. We can now run the server itself:
$ node serverLaunched at http://localhost:8000!
If we open a browser at http://localhost:8000, we will see our React application (see Figure 10-21).

Figure 10-21. The application running on our new server
So far, so good. But we aren’t actually doing any server-side rendering. For that, we will need to load some React code to load and
render the App component:
importexpressfrom'express'importfsfrom'fs'importpathfrom'path'import{renderToString}from'react-dom/server'importAppfrom'../src/App'constserver=express()server.get(/.(js|css|map|ico|svg|png)$/,express.static(path.resolve(__dirname,'../build')))server.use('*',async(req,res)=>{letindexHTML=fs.readFileSync(path.resolve(__dirname,'../build/index.html'),{encoding:'utf8',})constapp=renderToString(<App/>)indexHTML=indexHTML.replace('<div id="root"></div>',`<divid="app">${app}</div>`)res.contentType('text/html')res.status(200)returnres.send(indexHTML)})server.listen(8000,()=>{console.log(`Launchedathttp://localhost:8000!`)})
This new code uses the renderToString function from React’s SSR library react-dom/server. The renderToString function does
what you would expect. Instead of rendering the App component into a virtual DOM, it simply renders it into a string. We can
replace the empty DIV in the index.html content with the HTML generated from the App component. If you restart the server and
then reload the web browser, you will find that the application still works. Mostly (see Figure 10-22).
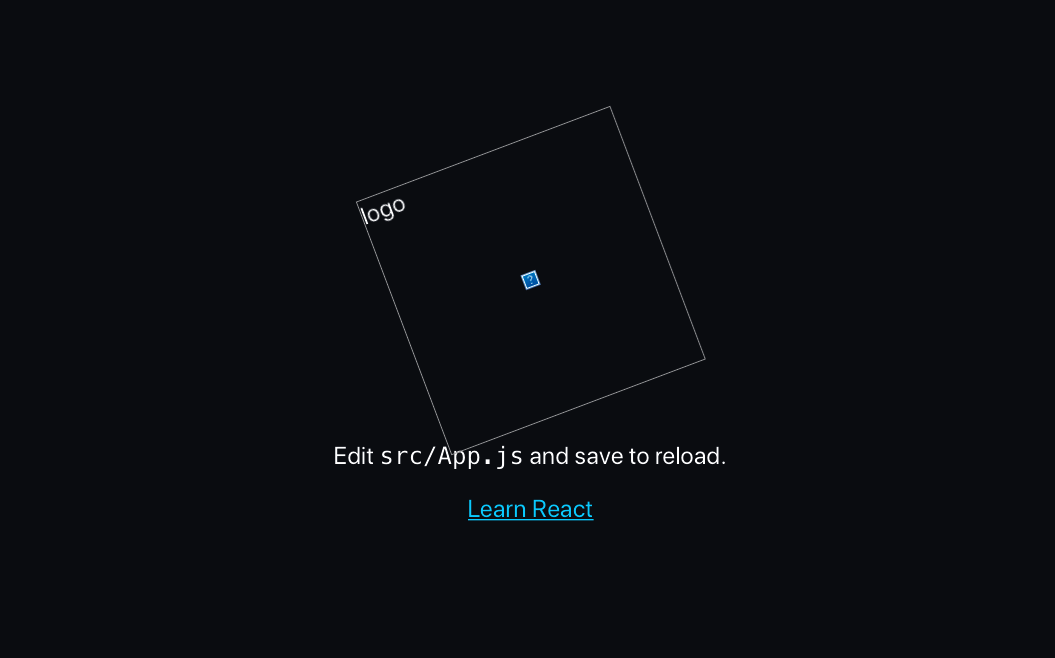
Figure 10-22. The React application showing a broken SVG image
Instead of seeing the rotating React logo, we instead see a broken image symbol. We can see what happens if we look at the generated HTML returned by the server:
<divid="app"><divclass="App"data-reactroot=""><headerclass="App-header"><imgsrc="[object Object]"class="App-logo"alt="logo"/><p>Edit<code>src/App.js</code>and save to reload.</p><aclass="App-link"href="https://reactjs.org"target="_blank"rel="noopener noreferrer">Learn React</a></header></div></div>
Something odd has happened to the img element. Instead of rendering an SVG image, it tries to load the URL “[object Object].”
What’s happening here?
In the React code, we are loading the logo like this:
importlogofrom'./logo.svg'...<imgsrc={logo}className="App-logo"alt="logo"/>
This code relies on some Webpack configuration from create-react-app. When you access the application through the development
server, Webpack will use a library called svgr to replace any imports of SVG files with generated React components that contain
the raw SVG contents. svgr allows SVG images to be loaded just like any other React components. That’s what allows us to import
them as we might import a .js file.
However, in our hand-built server, we have no such Webpack configuration. Instead of going to the trouble of configuring Webpack, we
can avoid the problem by copying the logo.svg file to the public folder and then changing the code in the App component to the following:
// import logo from './logo.svg'import'./App.css'functionApp(){return(<divclassName="App"><headerclassName="App-header"><imgsrc="/logo.svg"className="App-logo"alt="logo"/><p>Edit<code>src/App.js</code>andsavetoreload.</p><aclassName="App-link"href="https://reactjs.org"target="_blank"rel="noopener noreferrer">LearnReact</a></header></div>)}exportdefaultApp
If we now rebuild the application and restart the server:
$ yarn build$ node server
the SSR application will display the application correctly (see Figure 10-23).
Figure 10-23. The application now displays the SVG image correctly
There is actually just one step left, which we should implement. In the src/index.js file, we render the single-page version of the application like this:
ReactDOM.render(<React.StrictMode><App/></React.StrictMode>,document.getElementById('root'))
Remember, this code will still run, even when we access our application through the SSR server. The browser will download the
prerendered version of the web page, and it will then download the JavaScript for the SPA. When the SPA code
runs, it will execute the preceding code from index.js. The browser still needs to load and run the JavaScript to make the
interface interactive. The ReactDOM.render method may replace all of our prerendered HTML when it doesn’t need to. So if we replace
the call to ReactDOM.render with ReactDOM.hydrate, we will only replace the HTML in the DOM if it is different from the HTML in
the virtual DOM. For our server-side rendered page, the content of the static web page and the content of the virtual DOM should be
the same. The result is that hydrate will not update the elements on the page; it will just attach a set of event listeners to
make the page interactive.
So, we now have a server-side rendered application. But has it made the page load any faster?
The simplest way to test page load time is to run a Lighthouse performance audit within Chrome. Lighthouse, remember, performs a basic audit of a web page, checking performance, accessibility, and a bunch of other features. It will give us a metric that we can use to compare the two versions of the application.
When we tried this on a development laptop when accessing the ordinary React development server that comes bundled with
create-react-app, we got a performance grade of 91 out of 100 and a first contentful paint (FCP) time of 1.2 seconds (see Figure 10-24).
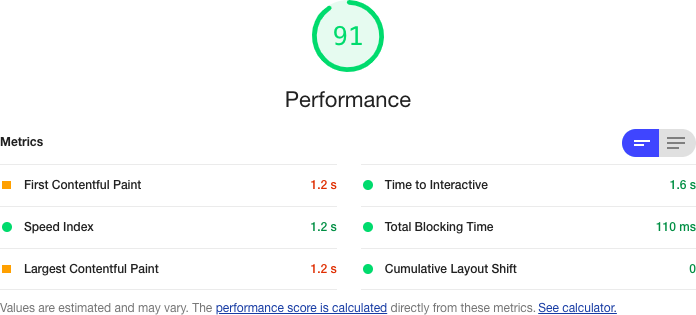
Figure 10-24. Base performance of the application, without server-side rendering
That’s not a bad performance score. But we are running a small React application.
What happens when we test the SSR version of the application? After all, the server will still have to spend some time rendering the React code. Will it run any faster? You can see the results of our test in Figure 10-25.
The overall score has increased to 99 out of 100. The time to FCP has dropped to 0.6 seconds: half that of our
original version. Also, if you load the original SPA version of the application in a browser and keep hitting Refresh, you will see
the page will often flash white for a moment before rendering the web page. The flash occurs because the downloaded HTML is just an
empty DIV, which the browser displays as a white page before the JavaScript can render the application.
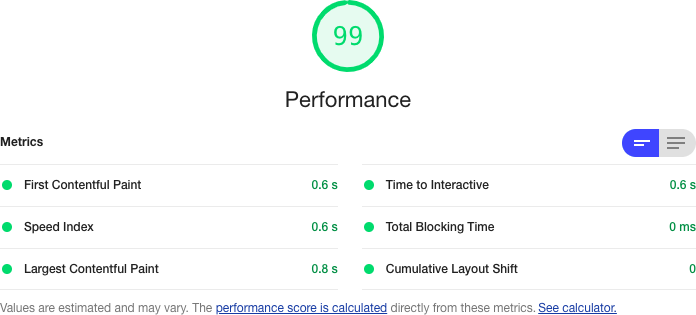
Figure 10-25. Performance of the application with server-side rendering
Compare that to the SSR version of the application. If you keep hitting Refresh on the SSR version, the only thing you should notice is that the rotation of the logo keeps resetting. You will see almost no flashing.
Even though there is still a render process occurring on the server, the time needed to render a string version of the HTML is less than the time needed to render the same set of DOM elements.
Discussion
In this recipe, we have taken you through the basics of how you might set up basic server-side rendering for your application. The details for your application are likely to vary quite a lot, dependent upon which additional libraries your application uses.
Most React applications use some form of routing, for example. If you are using react-router, then you will need to add some
additional code on the server side to handle the fact that different components will need to be rendered, based upon the path that
the browser has requested. For example, we can use the StaticRouter from react-router like this:
import{StaticRouter}from'react-router-dom'...constapp=renderToString(<StaticRouterlocation={req.originalUrl}context={{}}><App/></StaticRouter>)
The StaticRouter renders its child components for a single, specific route. In this case, we use the originalURL route from the
browser request. If the browser asks for /person/1234, the StaticRouter will render the App component for this route.
Notice that we can also use the StaticRouter to pass any additional context for the rest of the application. We could use the
context to pass content to the rest of the application.
If you are using code splitting in your application with React.lazy, you need to be aware that this will not work on the
server side. Fortunately, there is a workaround. The Loadable Components library does the same job as React.lazy, but it can also run on the server side. Therefore, Loadable Components gives you all of the advantages of server-side rendering with all the benefits of code splitting.
As with all optimizations, there is a price to pay with server-side rendering. It will require additional complexity in your code, and it will also require additional load on your server. You can deploy an SPA as static code on any web server. That’s not true for server-side rendered code. It will need a JavaScript server and may well increase your cloud hosting costs.
Also, if you know from the outset that you want to use server-side rendering for your application, you should probably consider a tool like Razzle or Next.js for your application and build server-side rendering from day one.
Finally, there are alternative approaches to SSR that can boost the performance of your web page without the need for server-side rendering. Consider using Gatsby. Gatsby can prerender your pages at build time, giving you many of the advantages of SSR without needing server-side code.
You can download the source for this recipe from the GitHub site.
Use Web Vitals
Problem
It is more important to have code that works and is readable than it is to have highly tuned code. Tuning, as we’ve seen, always comes with an associated cost.
But if there are noticeable performance issues, it is essential to become aware of them and fix them as quickly as possible. Much of the Internet relies upon passing trade. If people go to your website and it doesn’t immediately respond, they may leave and never return.
Developers often track server performance using trackers—known as beacons—embedded within the code. If there’s a performance issue, the beacons can generate an alert, and the developer can fix the problem before it affects a lot of users.
But how do we embed a tracking beacon into our client code?
Solution
We’re going to look at how to track web vitals. We mentioned web vitals in “Use Browser Performance Tools”. They are a small set of metrics that measure your application’s most important performance features, such as the Cumulative Layout Shift (CLS), which measures how much your application jumps around when it first loads.
Several tools, such as the Lighthouse Chrome extension, track web vitals. The name web vitals is intended to remind you of vital signs, like heart rate and blood pressure, because they tell you about an underlying issue that you need to address.
If you created your application with create-react-app, you probably already have code embedded that can automatically track the web
vitals of your application. If you look in the src/index.js file, you will see a call to report the web vitals at the end:
importReactfrom'react'importReactDOMfrom'react-dom'import'./index.css'importAppfrom'./App'importreportWebVitalsfrom'./reportWebVitals'ReactDOM.render(<React.StrictMode><App/></React.StrictMode>,document.getElementById('root'))reportWebVitals()
The reportWebVitals function can be given a callback function that can be used to track the various metrics while the application
is running. For example, if you pass it console.log:
reportWebVitals(console.log)
you will then see metrics appearing in your JavaScript console as a series of JSON objects (see Figure 10-26).
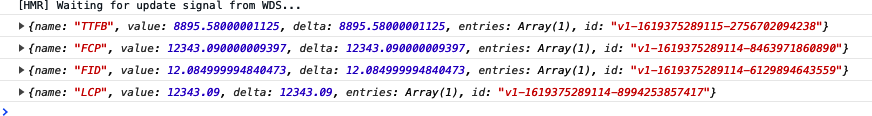
Figure 10-26. The web vitals in the JavaScript console
This is not really how you are intended to track web vitals. A better option is to send the data back to some backend store. For
example, you might choose to POST them to send API endpoint:
reportWebVitals((vital)=>{fetch('/trackVitals',{body:JSON.stringify(vital),method:'POST',keepalive:true,})})
Many browsers have a built-in function that is intended for use when recording vital measurements. The browser will cancel normal
network requests, such as those made by calling fetch, if the user leaves the page. Given that the most important web vitals
happen when the page loads, it would be a pity to lose these metrics. For that reason, you should consider using the navigator.sendBeacon function when it’s available:
reportWebVitals((vital)=>{if(navigator.sendBeacon){navigator.sendBeacon('/trackVitals',JSON.stringify(vital))}else{fetch('/trackVitals',{body:JSON.stringify(vital),method:'POST',keepalive:true,})}})
If the user briefly opens the page and then goes elsewhere, the navigator.sendBeacon will be allowed to complete its POST
request before dying.
Discussion
There are commercial tracking services available that you can use to record web vitals, such as sentry.io. If you have a performance monitoring system installed, you might also be able to wire it up using web vitals to provide additional performance monitoring for your system.
Finally, consider tracking web vitals with Google Analytics as described on the create-react-app site.
1 See “Shrink Your App with Code Splitting”.
2 For example, by checking that the component is in a particular state before performing some action.
3 If you run it in Node, performance.now() measures the time from the start of the current process.
4 An exception to this is in the case of GraphQL services. In GraphQL, the client can make a complex query to the backend, and a standardized query resolver will “stitch together” the results of low-level queries on the server. GraphQL can produce faster network responses without needing to tune the client.